
Mathematically-lean simulations in chemistry
----
Hugh M. Cartwright Physical and Theoretical Chemistry Laboratory, Oxford University
South Parks Road, Oxford, England OX1 3QZ

To enhance display speed, you may download this paper by anonymous ftp from muriel.pcl.ox.ac.uk Retrieve all files from the pub/papers/chemconf97 directory using binary mode, then use a web browser to view ccpaper6.html. A Postscript version of the paper is available in pub/papers e-mail can be sent to the author by clicking on the e-mail address above.

2 The place of simulation in the undergraduate course
3.3 Visualisation of idealised behaviour
3.4 Simulation at the atomic and molecular level
4.3 Development of scientific intuition
5.2 Freedom in variable adjustment
5.3 Avoidance of mathematical complexity
5.4 Insight into the physical origin of equations
5.5 Revelation of complex behaviour derived from simple equations
Computers are somewhat cheaper than most scientific instruments and considerably cheaper than a professor. Unsurprisingly, this leads to their widespread use (Table 1).
|
Table 1. Typical uses of computers in university chemistry departments.
|
|---|
The contribution which computers make varies from one department to another, depending on the machines available, local expertise, and the teaching philosophy of the department. Consequently, their impact on student learning is far from uniform.
Where the computer is used primarily as an administrative tool, for example to store student records, there is little direct benefit to the student. Similarly, when students have ready access, but the computer is used just to word process laboratory reports or assignments, it does not contribute a great deal to scientific understanding. Students' keyboard and computer skills improve, but the computer is not helping them to understand "why things are the way they are".
When employed scientifically, computers may help students to balance equations or use VSEPR to predict the shape of molecules, but this may just be a disguised "programmed learning" text. The application of rules to determine molecular shapes or balance equations is, in a sense, a mechanical operation which can be carried out without knowledge of the underlying science.
The primary aim of a chemistry course must be to develop in students an appreciation of how the material world behaves, and this requires that the computer play an active, positive role in learning. Simulations are a key way in which this can be done. They have long been a part of chemistry, and although longevity is not in itself a persuasive argument for their use, they find a place in most courses. We argue in this paper that the greatest potential of the computer is to run simulations which can help develop understanding of the molecular world.
Detailed simulations of scientific phenomena can provide an insight which transcends a mathematical description, and an understanding of how materials behave is at least as important as being able to express that behaviour in algebraic terms. By interacting with a computer model students can develop an understanding that - at its best - becomes almost intuitive.
2. The place of simulation in the undergraduate course
The level of detail may be limited by the facilities available, (it is a common observation that, no matter how much computer power a chemist has, it is never enough). Nevertheless, sophisticated simulation is not always necessary; a detailed view might conceal important generalisations, and thus be counterproductive. Consequently, both molecular level simulations and their coarser counterparts, in which behaviour in the bulk is simulated, have a role to play in a chemistry course. It is important to realise, though, that they are not equivalent. Visualisation of equations, which is essentially what most bulk-level simulations involve, is one step removed from the "real" world of atoms and molecules; in some ways this lessens their value and their impact in teaching.
Computer visualisation can be introduced almost anywhere in chemistry course, but grapeshot firing of simulation into the course is rarely desirable. A simulation must justify its place no less rigorously than a lecture or practical experiment. (Equally, lectures and experiments should be able to justify their existence against the competition provided by simulations). To do this, the simulation must teach concepts more efficiently, must give students a special insight into a topic, or perhaps link together disparate areas of the subject. It must not be a soft financial option whose raison d'etre is to allow administration to replace professors, or keep students quiet when there are not enough spectrometers to go around.
Variety is beneficial in learning, so a mixed diet of simulation, lecture, experiment and discussion will do much to stimulate students' appetite for chemistry.
3. Categories of Simulation
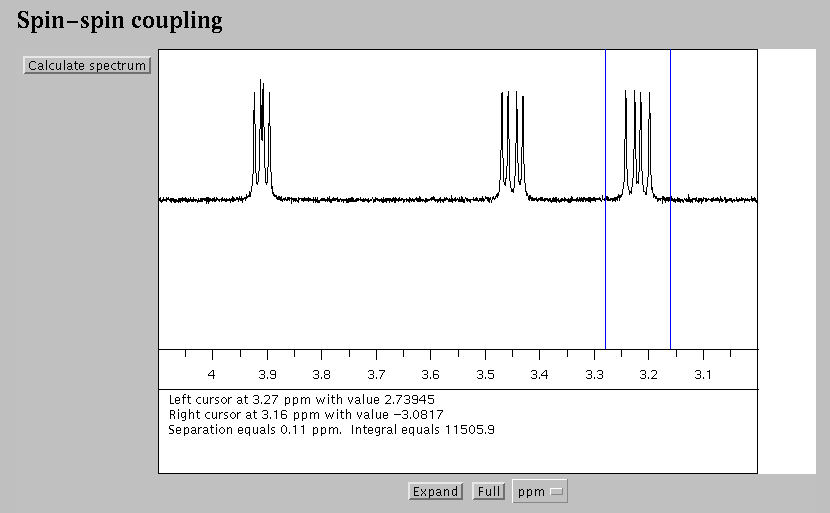
Fig. 1. The spectrum calculated by a "Black Box" NMR instrument. This display is created by a Java applet [1]
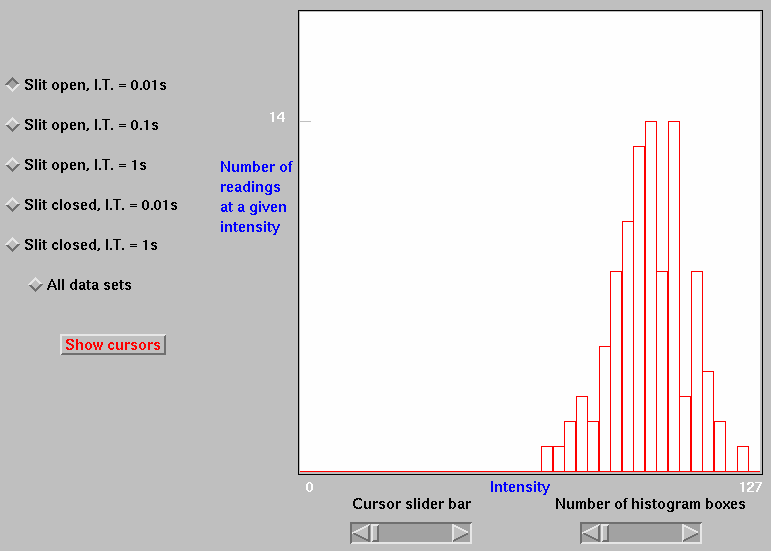
Black Box simulations can also be used to provide remote Internet access to real equipment. The Black Box element then consists of software which allows the student to control equipment in a user-friendly fashion (Fig. 2).
Most of the earliest simulations in chemistry were built around the interpretation of equations describing bulk behaviour. For example, the P-V-T behaviour of an ideal gas can be understood by investigating how the volume of a gas trapped by a moveable piston changes as the pressure or temperature of the gas is adjusted. Such a simulation is independent of the behaviour of individual molecules. Indeed, even the presence of molecules is not acknowledged, since it is the behaviour of an equation which is simulated (in this case, PV=nRT ), rather than the behaviour of an aggregation of molecules.
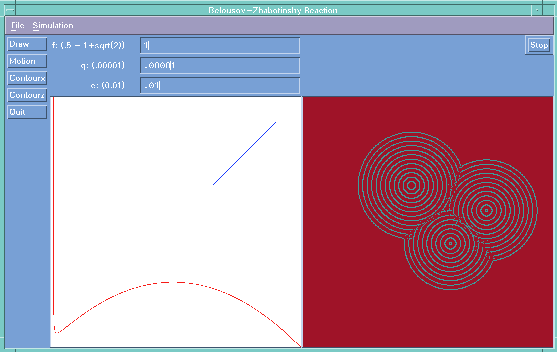
While this paper argues that simulation of equations is not always the most productive way to proceed, sometimes such an approach is unavoidable. Fig 3 illustrates a simulation of the Belousov reaction, in which calculation at the molecular level is very involved, so that bulk calculation is the only realistic way to proceed.
Simulations need not be correct to be useful. From the Bohr planetary model onwards, students meet chemical models which are idealisations or approximations. On occasion it is helpful to isolate for inspection one aspect of molecular behaviour which, in a real system, cannot actually be isolated.
Even molecules of modest size have many modes of vibration (according to the 3n-5 rule for linear molecules, or 3n-6 for non-linear molecules, where n is the number of atoms in the molecule). The vibrational motion which results is complex, even in quite simple molecules (Fig. 4).
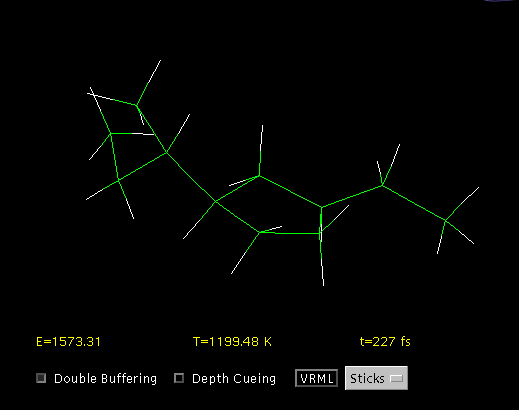
Fig. 4. A vibrating molecule displayed by a Java applet. [4]
When students meet normal modes and characteristic frequencies, it is helpful to discuss the vibrations of functional groups as though a group is capable of vibrating completely in isolation from the rest of the molecule. This can be illustrated using an idealised model in which only one mode is active. This qualitative picture - though unrealistic - both clarifies the concept of characteristic functional group frequencies, and can be used to show how vibration affects the symmetry of the molecule, thus leading into selection rules. A scientifically unjustifiable simulation can in this way be of value.
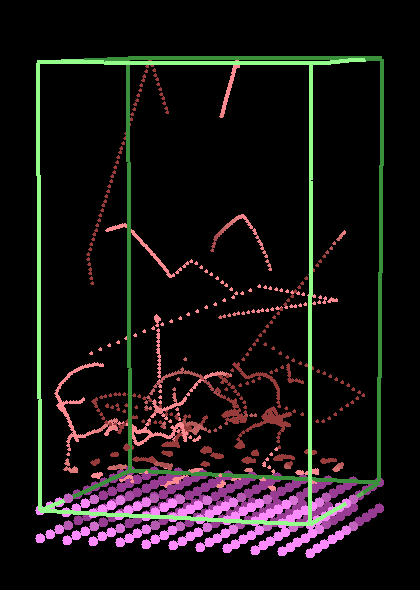
Such simulations are computationally demanding, and represent the practical limit of simulations at present, since a further dissection into the movement of electrons and nuclei leads to intractable calculations. As an example of such a simulation, Fig 5 shows the establishment of a concentration gradient for argon atoms above a solid surface under the influence of (very strong!) gravity.
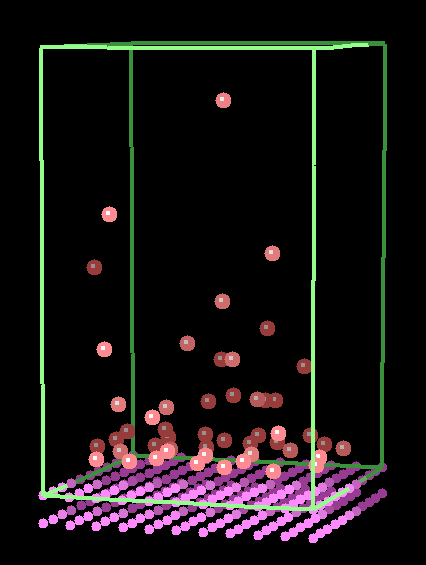
Fig. 5. Simulation of the movement of gas phase argon atoms above a solid surface. [5]
There are various advantages to such a simulation, which we shall shortly consider. We can note immediately that minimal assumptions are made in the calculation: we assume only that
 collisions are elastic
and that
 energy is a function of vertical
position.
Complex behaviour (such as the Maxwell-Boltzmann distribution of molecular speeds, or the Boltzmann variation of density with height) emerges readily from the simulation, and it is the way in which detailed physical behaviour can be shown to be the result of simple physical interactions that represents one of the most potent features of molecular-level simulation
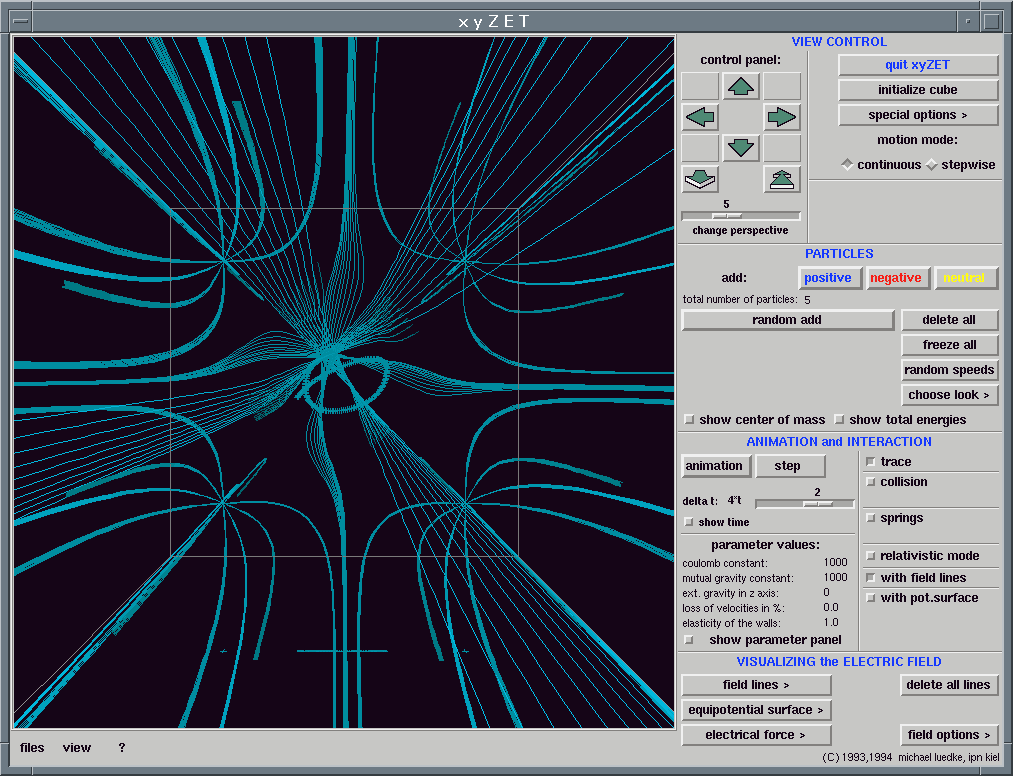
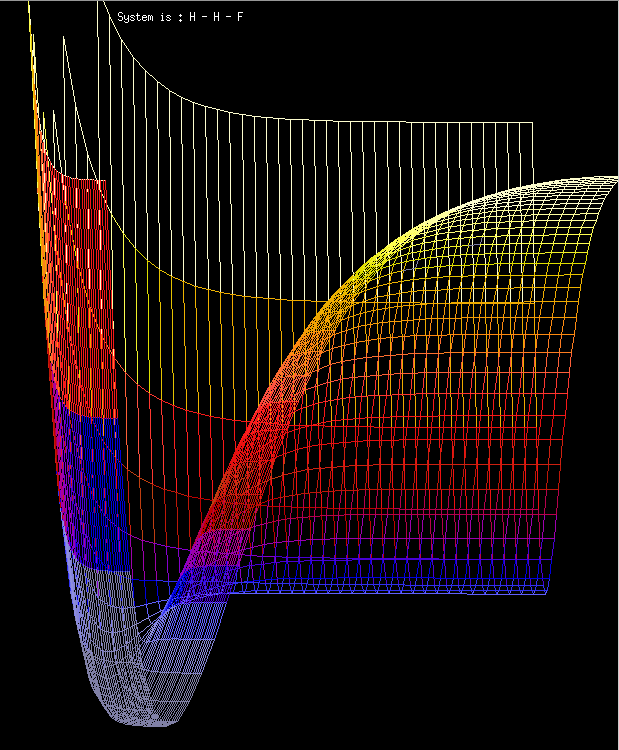
Interactivity is also a powerful argument in favour of simulation. Users quickly become bored if they are just passive consumers of information. They learn better when they need to respond frequently to, and have control over computer software.
It should be appreciated though that interactivity carries with it some dangers. A conventional program which channels all users along a pre-defined track depends on that track being chosen with care, and on it being suitable for almost every user. Interactive software by contrast presents the user with many facilities and numerous choices. This flexibility may remove from the user any sense of direction, and they may effectively become lost. They can lose sight of the academic objectives of the work, and lapse into ineffective meandering through the software. Interactive software must therefore be sufficiently structured that users do not lose sight of the educational target,
The use of html wrappers and embedded Java applets can provide this essential structure, though there are of course other equally effective ways of ensuring that users are not submerged in a complex multi-faceted simulation.
In any set of computer-mediated exercises the instructor must decide upon the most suitable order in which topics are to be presented. In mathematically-based exercises a progression from mathematical simplicity to sophistication may be used.
We might progress from point masses to masses of finite volume and eventually to molecules. This may be a justifiable course, but there is no reason why an order determined by an increase in mathematical complexity should coincide with the order which is academically most desirable. It might perhaps be desirable to present a comprehensive simulation initially, and gradually uncover its mathematical basis as the underlying science is studied.
Women are under-represented in most areas of science, particularly in the physical sciences. For many people who teach at school, college or university, this is a cause of concern, and much effort has been devoted to searching for ways to redress the imbalance.
The limited number of female science teachers and professors, and the rarity of female scientists on the television may have an effect, but there are probably other factors at work. Anecdotal evidence - drawn from observation of a group of students at Oxford - suggests that female students are often harder working, but may have less "flair" for science at the university level.
By contrast, their male compatriots sometimes seem to have a greater sense of scientific "intuition". What does this mean? Suppose we find a stream blocked by a child's dam. We can assess whether it is a "good" dam (in the sense of being strong enough to hold the water back) without considering any hydrostatic or hydrodynamic equations. Indeed, the problem of whether a particular sticks, stones and mud dam is "good" would present a testing computational problem.
But how then do we assess the quality of the dam, if not by using equations? Presumably, through having built dams - or having seen them built - and in so doing, having gained practical experience of what a "good" dam looks like. We have accumulated a fund of knowledge which is ill-defined, incomplete and fuzzy, yet still useful scientifically. This is not "intuitive" knowledge in the normal sense, but a collection of experience which gives us a feel for how things behave.
Those students who possess this sort of scientific intuition have built this up from childhood, perhaps through building dams, throwing stones and falling off trees, but also - crucially - through the challenge provided by science teachers whose approach is first to get their students to understand the physical principles of science, and only later to learn the rules, facts and equations.
Scientific intuition may help when students have to guess at appropriate ways to tackle a novel problem, or rationalise a newly-discovered equation, trying to understand why it has the particular form it has. Inasmuchas the simulation allows the user to experiment and interact with the material world, it will stimulate the development of this intuition. Simulations thus teach not only a particular topic, but provide also broader scientific experience.
Much science depends upon the interpretation and use of equations. Simulations of equations have a role to play, but the understanding which students gain from them is different from that which they derive from molecular simulations.
Of course, all simulations make use of equations and rules. Without a prescription to determine how objects appear on the computer screen and interact with each other, there could be no simulation. In a mathematically-lean simulation, these equations and rules are kept to a minimum.
For example, returning to PV=nRT , a simulation of gases requires us only to assume that gas molecules move, that they do not interact except during collisions, and that collisions are elastic (no energy loss). If we wish to introduce non-ideality, we can allow the molecules to have non-zero size, or interact with a Morse or a 6-12 potential. Notice that our assumptions are physically based. That is, we are assuming properties of the components which make up the physical system, not assuming equations which describe observed behaviour, such as the van der Waals equation. This is the key idea behind mathematically-lean simulations.
We have noted in section 3.4 that, from simple assumptions, complex behaviour can be derived. We now consider some further advantages of molecular-level simulation.
Although these global equations encapsulate the behaviour of the system which they describe, it may be hard for students to extract from them that detailed behaviour.
Let us consider an example from mechanics. Fig 8 shows a beam, hinged at its base, falling under gravity.
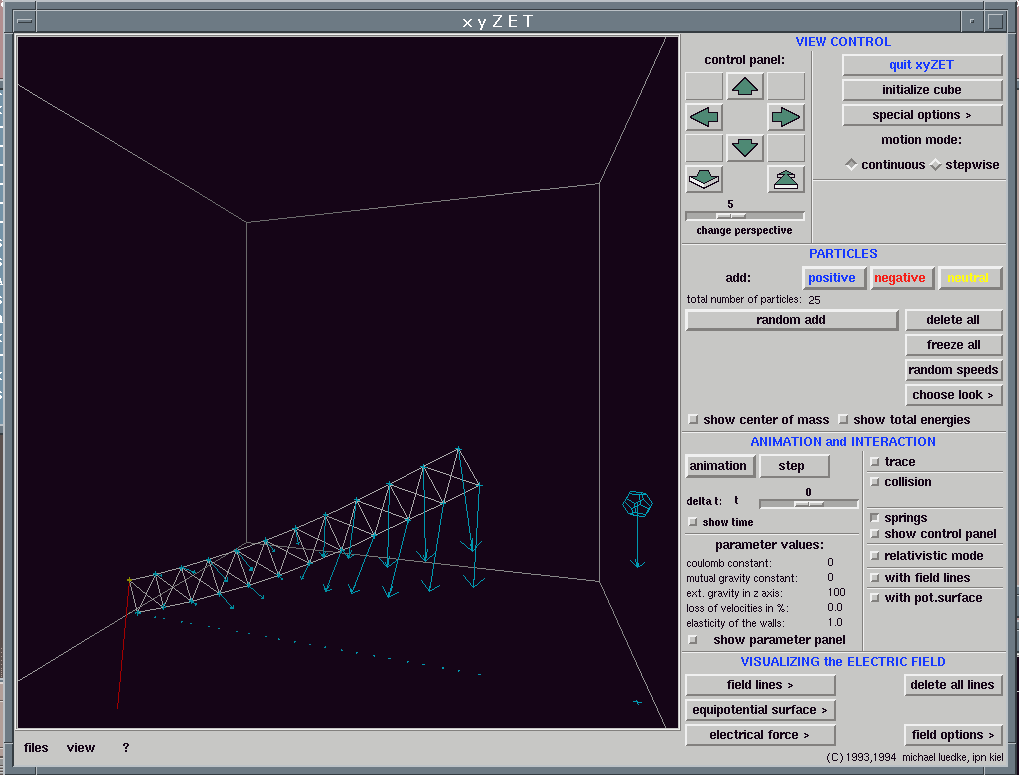
Let us allow the beam to fall; how will it strike the floor? There are three options:
 the
end of the beam furthest from the hinge will strike the floor first;
 the beam will
have recovered its shape and be exactly linear when it strikes
the floor, so that all
points along the lower edge will make contact simultaneously;
 the bending shown in the figure will remain, as gravity is
constant, so there will be a "rolling collision" in which contact is
made first by points closest to the hinge, and contact
spreads along the beam towards the end.
the bending shown in the figure will remain, as gravity is
constant, so there will be a "rolling collision" in which contact is
made first by points closest to the hinge, and contact
spreads along the beam towards the end.Which of these possibilities is correct? The equation which describes the behaviour of a such a beam of connected masses would tell us, but doubtless this equation is complex, and it would be no simple matter to determine from it how the shape of the beam varies. It is simpler to run a simulation, the results of which are shown in figures 9a to 9e below.
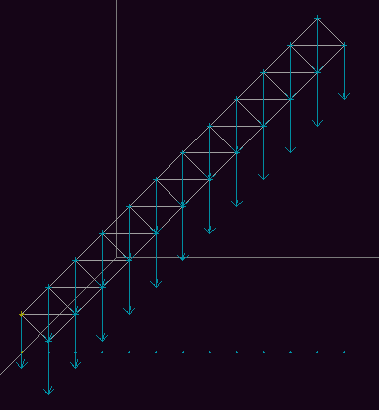 Fig 9a. The initial configuration of the beam.
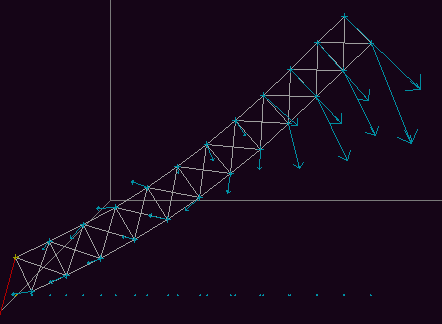 Fig. 9b. Considerable curvature is apparent shortly after the
beam begins to fall.
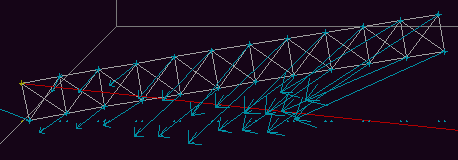 Fig. 9c. The combination of gravity and the unequal stretching of
the sides of the beam, shown in figure 9b, are forcing it to straighten.
 Fig. 9d. The curvature of the beam has been over-corrected,
and the beam is now nearly horizontal.

Simulations whose role is to display the behaviour of equations usually allow the user to specify the values of parameters which appear in the equation. There is little point in allowing the user to specify other parameters, which cannot affect the calculation.
In a molecular-level calculation, the few equations which underlie the calculation are usually hidden from the user, and often contain "within them" further equations (section 5.3). The user can then be permitted to vary a wide range of parameters to investigate whether or not they influence the system.
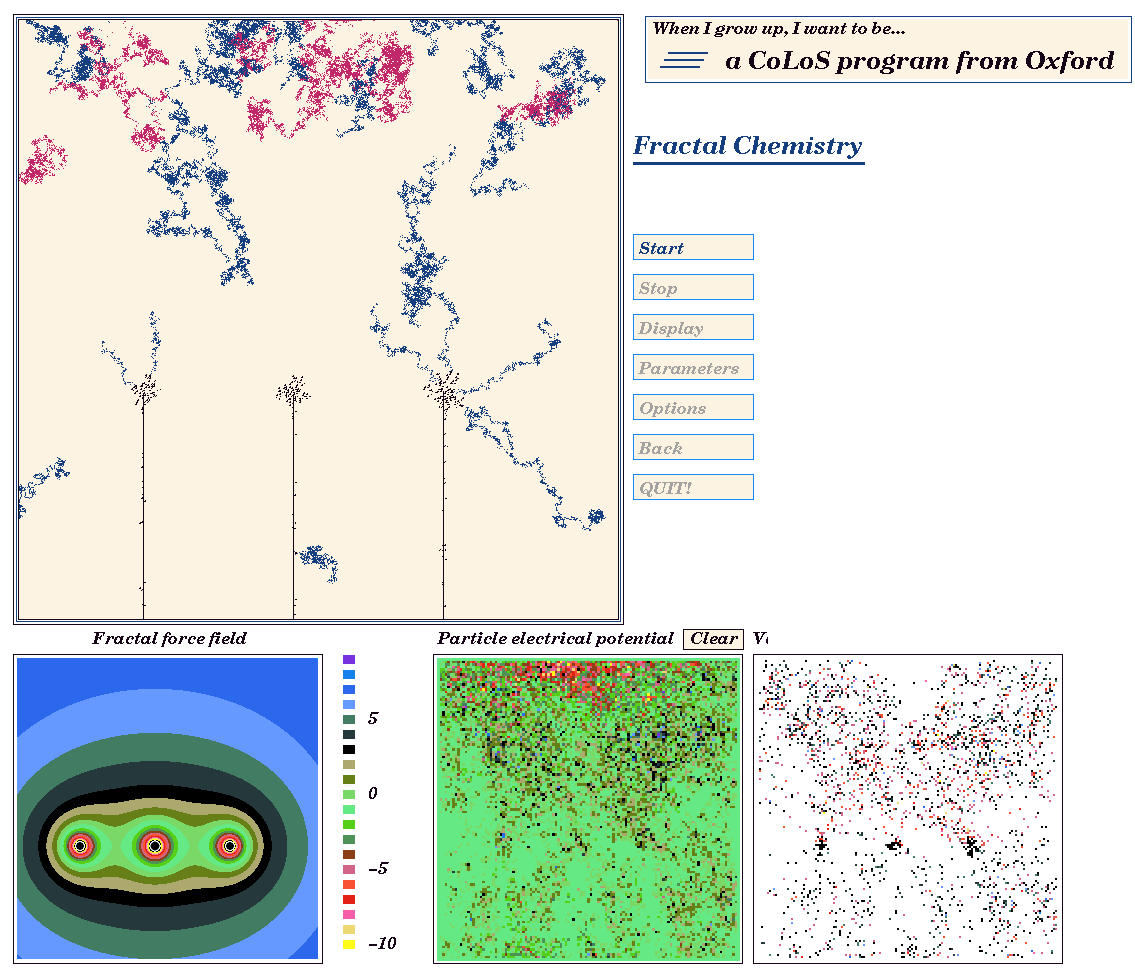
For example, the screen shot in Fig 8 is taken from a CoLoS demonstration program dealing with fractal growth in solution. The user can investigate how the growth of copper fractals depends upon temperature, solution viscosity, concentration, potential difference and other factors. By making minimal assumptions, but providing maximum flexibility, it is possible to investigate combinations of parameters which the software designer might never have considered. By calculating the movement and interaction of ions at the most basic level, rather than using equations which describe fractal deposition directly, the user has considerable freedom to discover how fractal growth is influenced by the various parameters.
Students can, for example, learn qualitatively about the relationships between the temperature of an assembly of molecules and the vapour pressure without first (or ever!) meeting the Clausius-Clapeyron equation. They can develop an understanding of heat capacity, or colligative properties, from simulations, such as that shown in Fig 11.
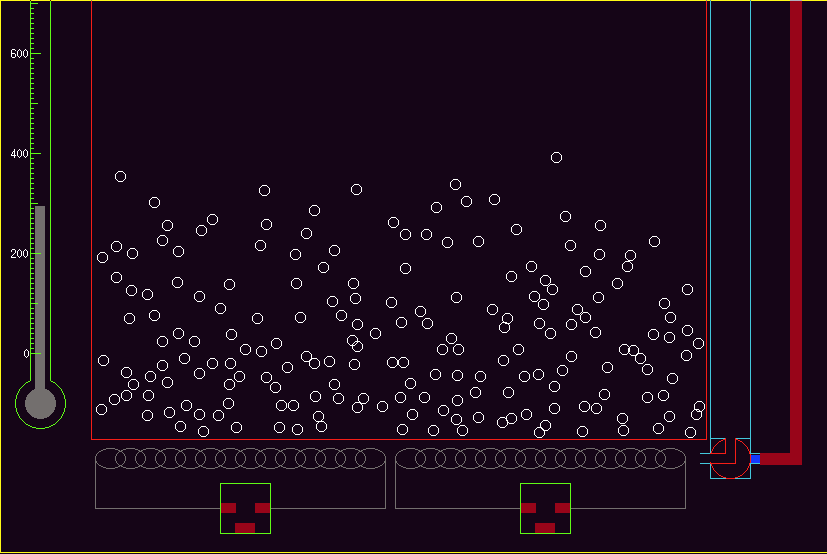
The Clausius-Clapeyron equation expresses the dependence of vapour pressure of a volatile solid or liquid on temperature. It contains differentials (or logs in the integrated form). It is an important equation in thermodynamics, but though it is not particularly complex, it still presents students with difficulties. Students may not appreciate qualitatively that vapour pressure rises approximately exponentially with temperature. A simulation of a collection of molecules, assuming a simple interaction potential, will allow students quickly to investigate the dependence of vapour pressure on T.
The experimental behaviour is not "built-into" the simulation - indeed thermodynamic properties are defined only for bulk systems, and the simulation is of individual molecules. Nevertheless, with a sufficiently large number of molecules, the user can measure vapour pressure and investigate P/T relationships.
In a two phase (gas/solid) system, one can illustrate the principles of Langmuir or BET behaviour (even to the level of surface movement of adsorbed molecules and enhancement of reactivity on the surface) using again simple interaction potentials. (Fig 12).
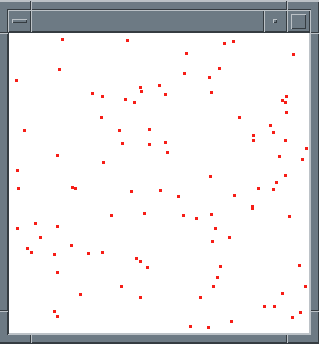
Most students need to memorise and be able to regurgitate equations in an exam. But they need also to appreciate the physical origin of gas pressure, that is, the bombardment of the walls of a container by molecules. There is more fundamental understanding to be gained by realising that, if the volume is restricted the number of collisions of molecules with the walls per second must increase, than by simply learning that P depends inversely on V.
With the simplest of equations, quite complex behaviour can be modelled. Fig 14 shows the symmetrical fractal obtained when a centro-symmetric field is provided by an electrode in a dilute solution.
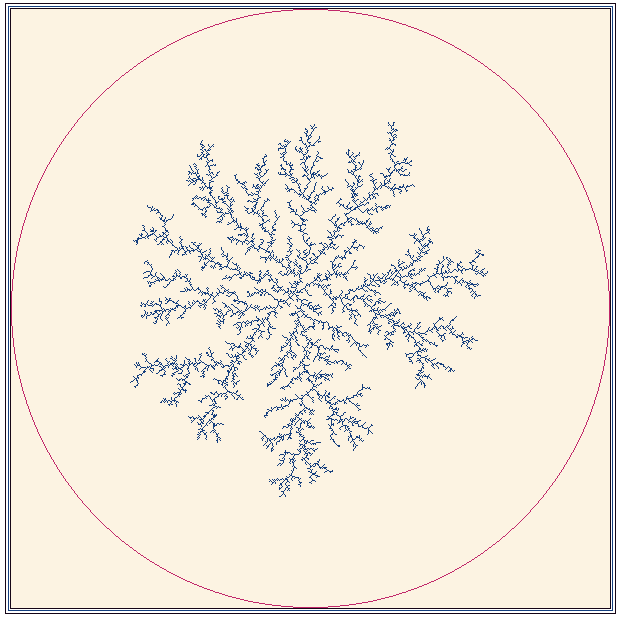
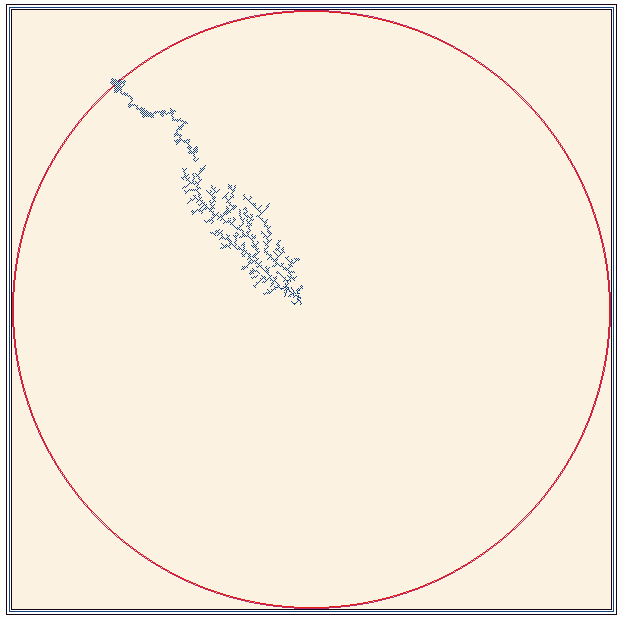
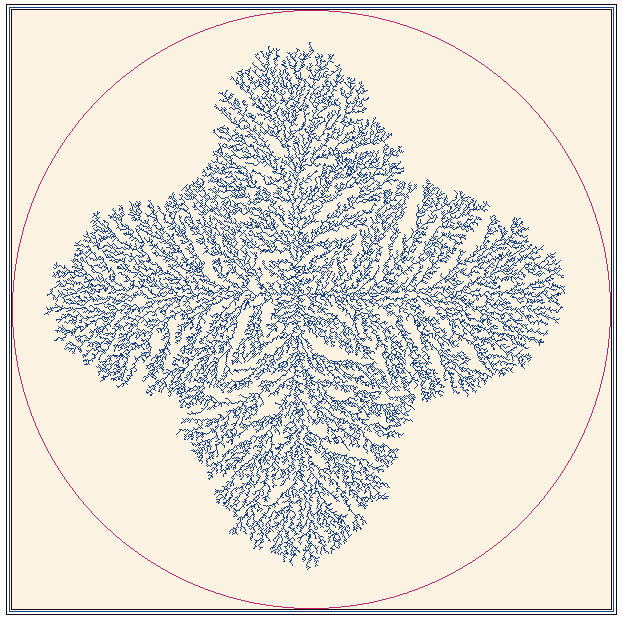
Fig. 16. A fractal growth generated by an electrode which provides a field aligned along the x-y axes.
A chemist who understands only equations is really a mathematician. A chemist who has a feel for the way in which molecules behave, and who thinks that he or she knows what molecules want to do is a scientist.
References and background information. 1. Taken from an experiment in NMR spectroscopy under development at Oxford University.
2. Taken from an on-line experiment in error analysis under development at Oxford University. Data are generated by connecting to an optical rig through the Internet.
3. Data from Computer simulation of the Belousov-Zhabotinsky reaction, Chi Ho Lam, Chemistry Part II thesis, Oxford, 1996
4. A java applet showing a vibrating molecule: http://www.pc.chemie.th-darmstadt.de/java/
5. Screen shot from a simulation written using X, C and Motif. Pete Bennett, Mathematical modelling and computer simulation of Aspects of surface science, Chemistry Part II thesis, Oxford University, date.
6. An experiment under the control of the CoLoS program xyzet .
7. Screen shot from an experimental CoLoS program on fractal growth.
8. A screen shot from a CoLoS demonstration program on the thermodynamics of simple liquids. Andy Armstrong, Computational modelling and simulation of molecular phase dynamics. Chemistry Part II thesis, Oxford University, June 1995.
9. A screen shot for a simple simulation of gas-phase molecules.
10. The virtual lab in Oxford is at http://neon.chemistry.ox.ac.uk
11. An interactive computer simulation of collisional potential surfaces, Russell Strevens, Chemistry Part II thesis, Oxford University, England, 1995